


Timeout effectiveness in beach volleyball - when and how?
Part 3 of using rally level data to find new insights in beach volleyball

Imagine this: It's tied 19-19 in overtime and an NFL kicker lines up for the game-winning field goal. Suddenly, the opposing team calls a timeout, aiming to disrupt the kicker's focus and sway the game's outcome. Similar mind games unfold in beach volleyball, where timeouts are strategically used to break an opponent’s serving rhythm and sway the momentum the other way.
In amateur CBVA tournaments, I notice timeouts are called to “ice” the server after they’ve gone on a hot streak. Anecdotally, it seems like timeouts pay off by getting players to miss the next serve – but do the stats support this intuition?
For background, teams on the FIVB tour are allotted 1 timeout per set to take a breather and re-strategize.
Using data from Beach-Data, which includes FIVB Elite 16, Challenger and Tour Finals tournaments, I looked at the points played immediately following a timeout (called by either team)
Are timeouts effective?
To my surprise, serve errors actually go down after timeouts, at least in professional FIVB tournaments. This trend holds steady across main draw, qualification, elite 16, and challenger matches on both the men’s and women’s tours.
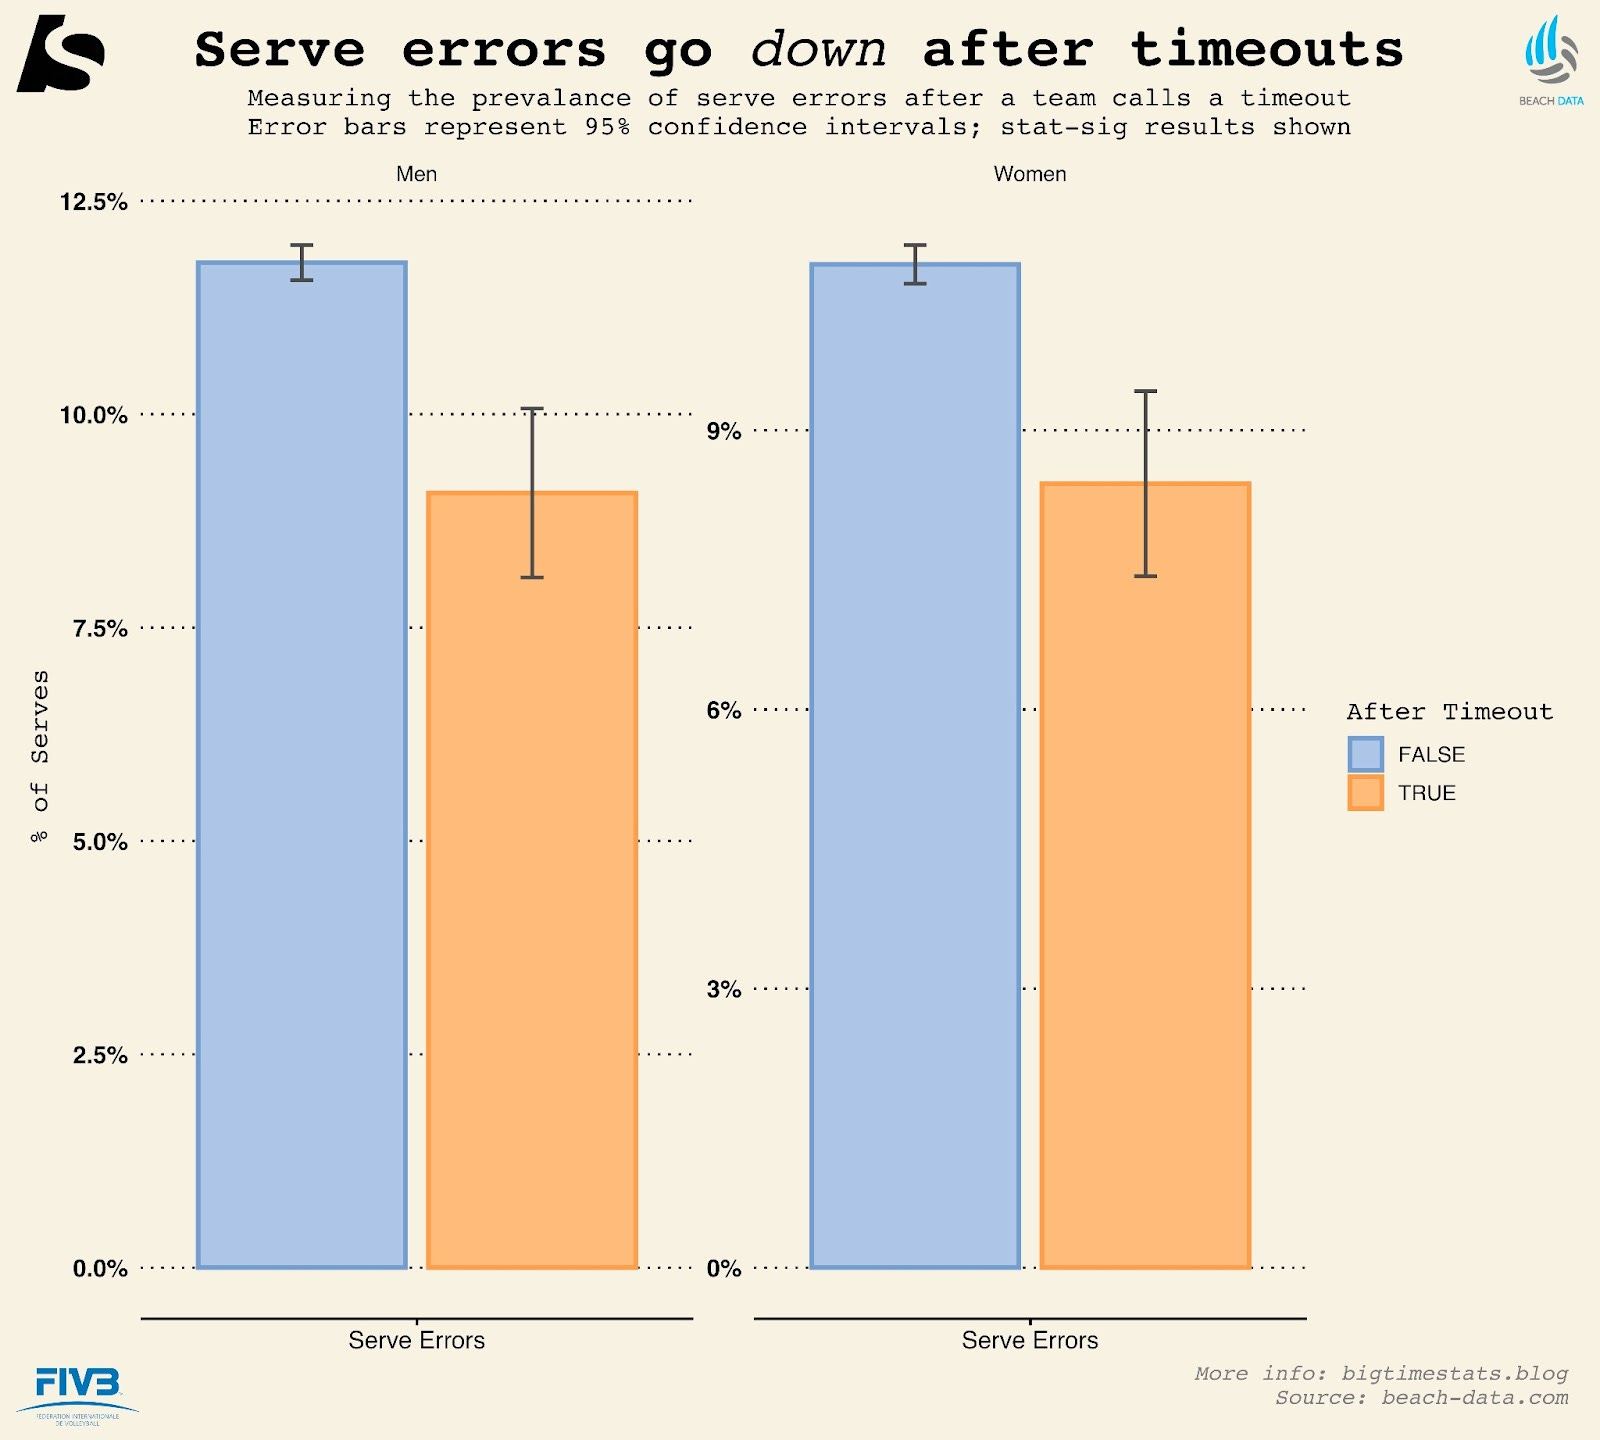
The results are statistically significant, meaning the probability of seeing results as extreme as shown is fairly low. However, our results are not from a controlled experiment. Therefore, other confounding factors, especially relative team strength and scoreline differences are likely contributing to the results.
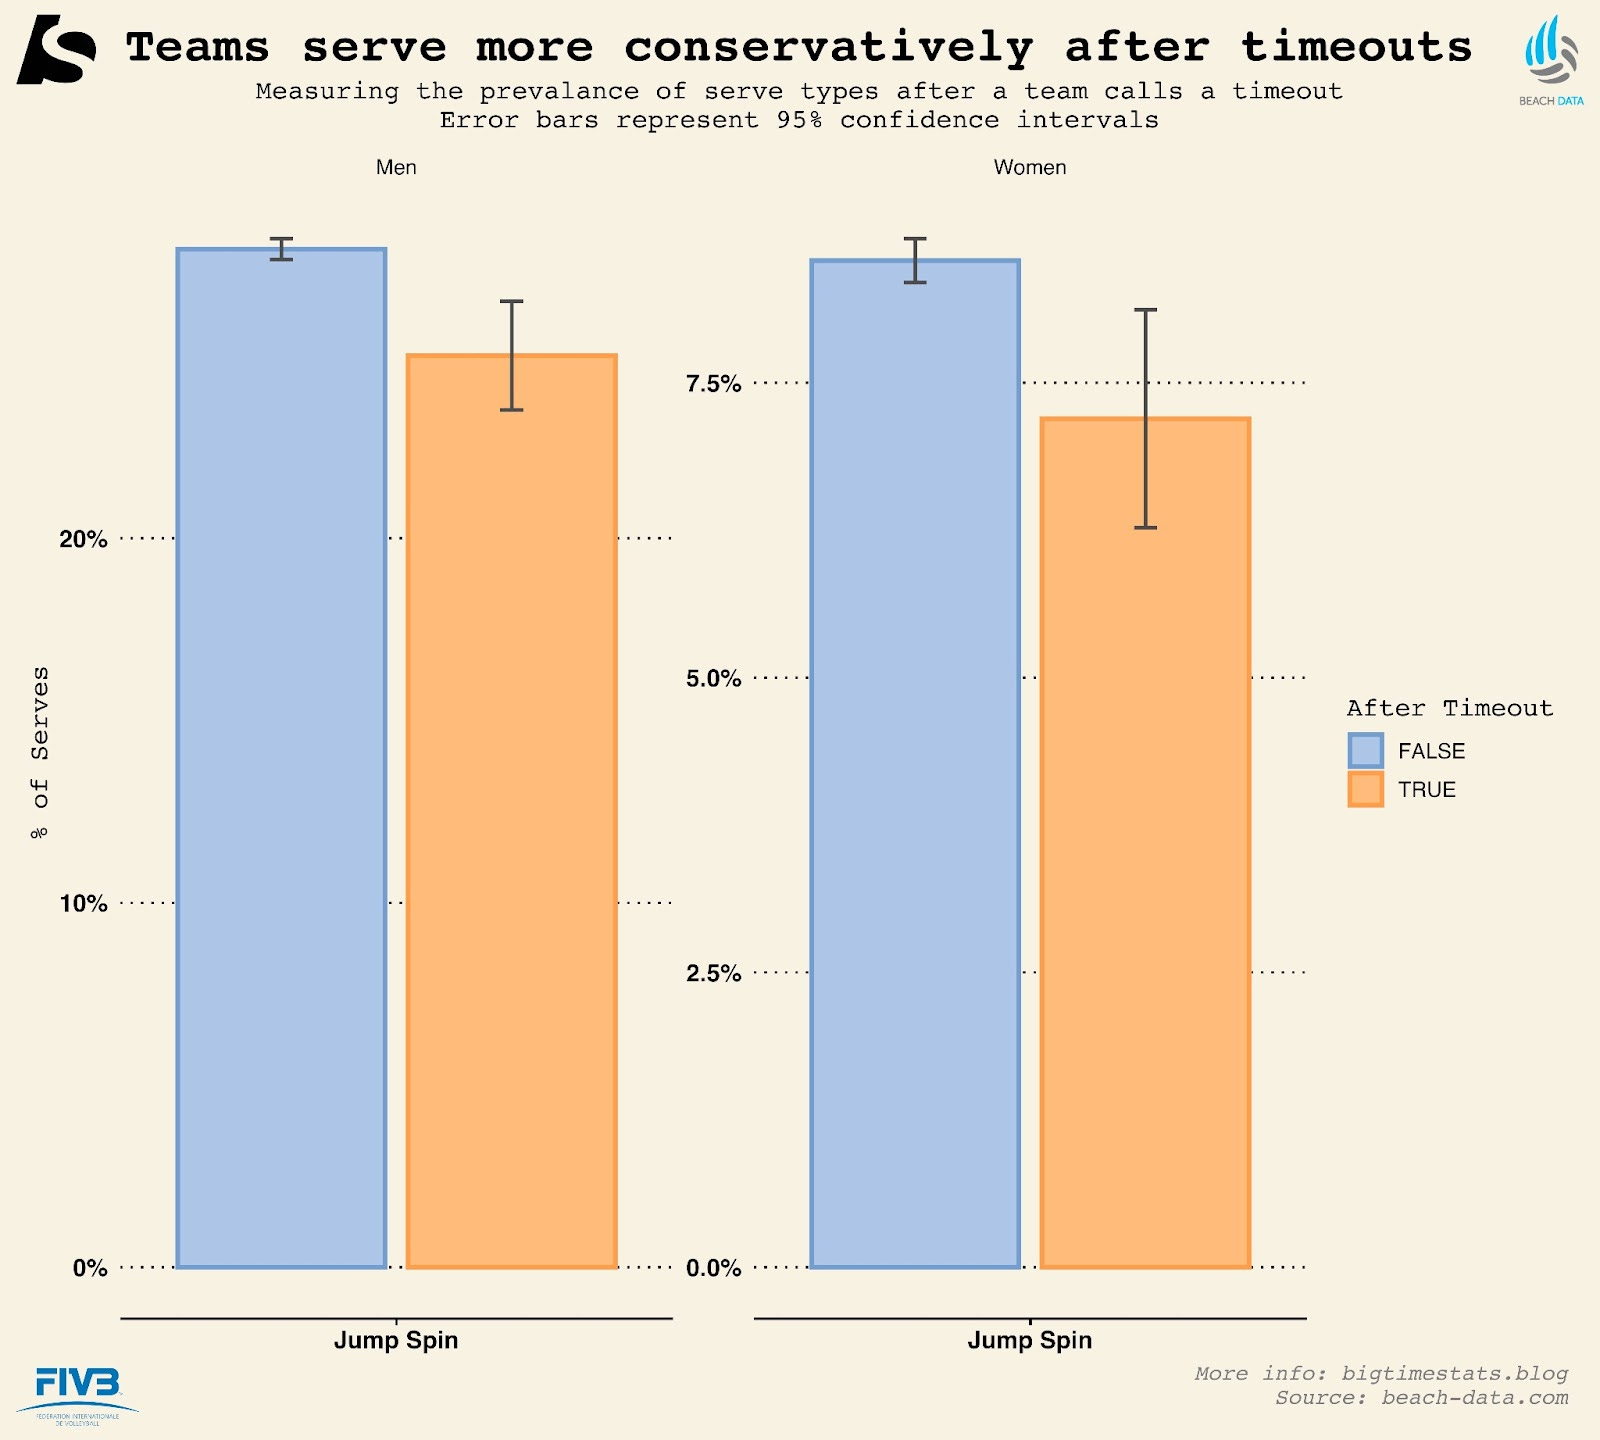
It’s possible that teams who are ahead in the scoreline want to avoid giving away free points to struggling teams. In fact, teams are less likely to hit aggressive jump spin serves after a timeout than at other times during the match.
So, when do teams call the most timeouts?
Looking at the “density” of timeouts by scoreline, we notice that most timeouts are used later in the set during close scorelines. The most common timeout scoreline is 16-14, highlighted in the graph as the most dense red area representing ~1.3% of all timeouts. This is not surprising given there are more 16-14 scorelines in the dataset than 1-sided starts like 5-0.
Other regions such as 20-0 have no timeouts given there aren’t any matches with that scoreline.
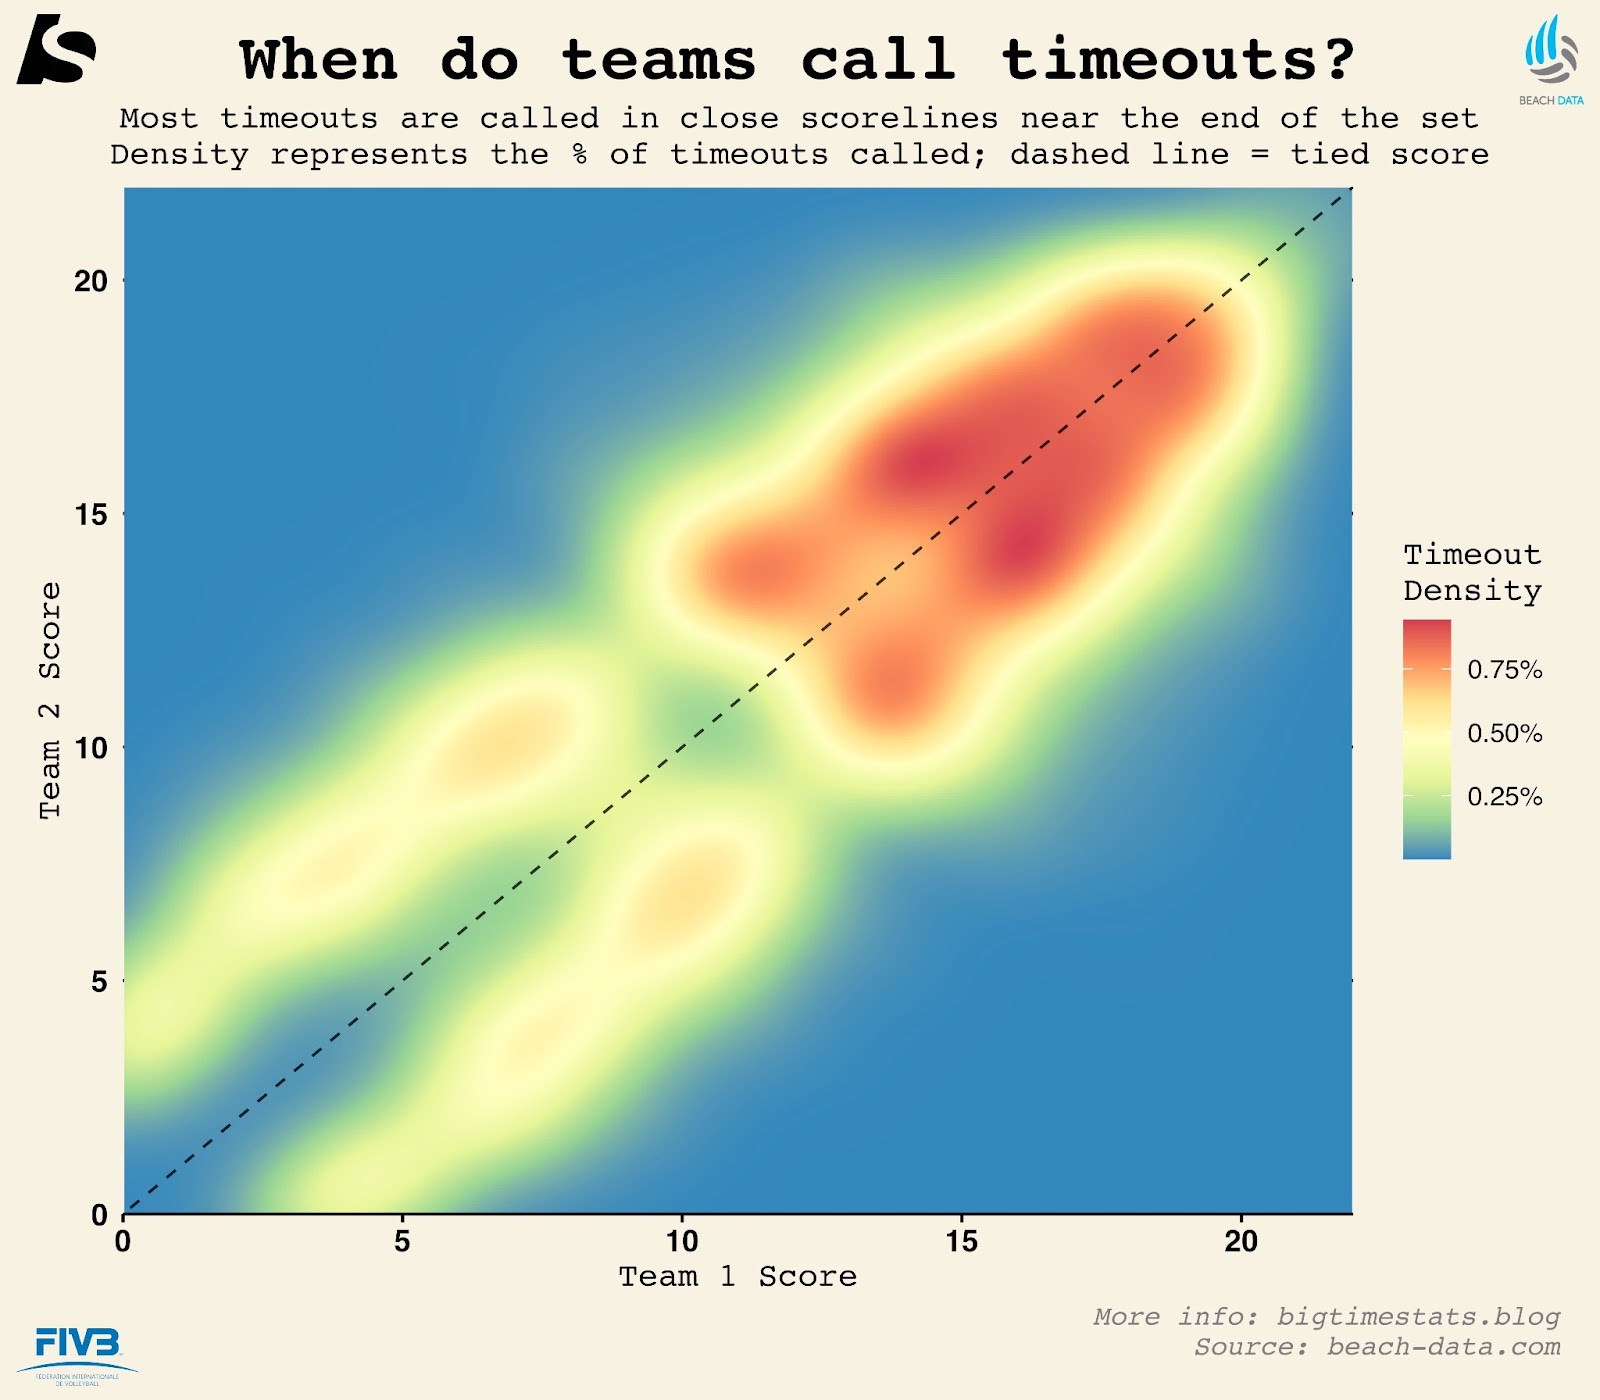
Few notes: You can think of density as # of timeouts called in that scoreline / # of total timeouts called (in all scorelines). Data is mirrored where a score of 16-12 would also show up as 12-16.
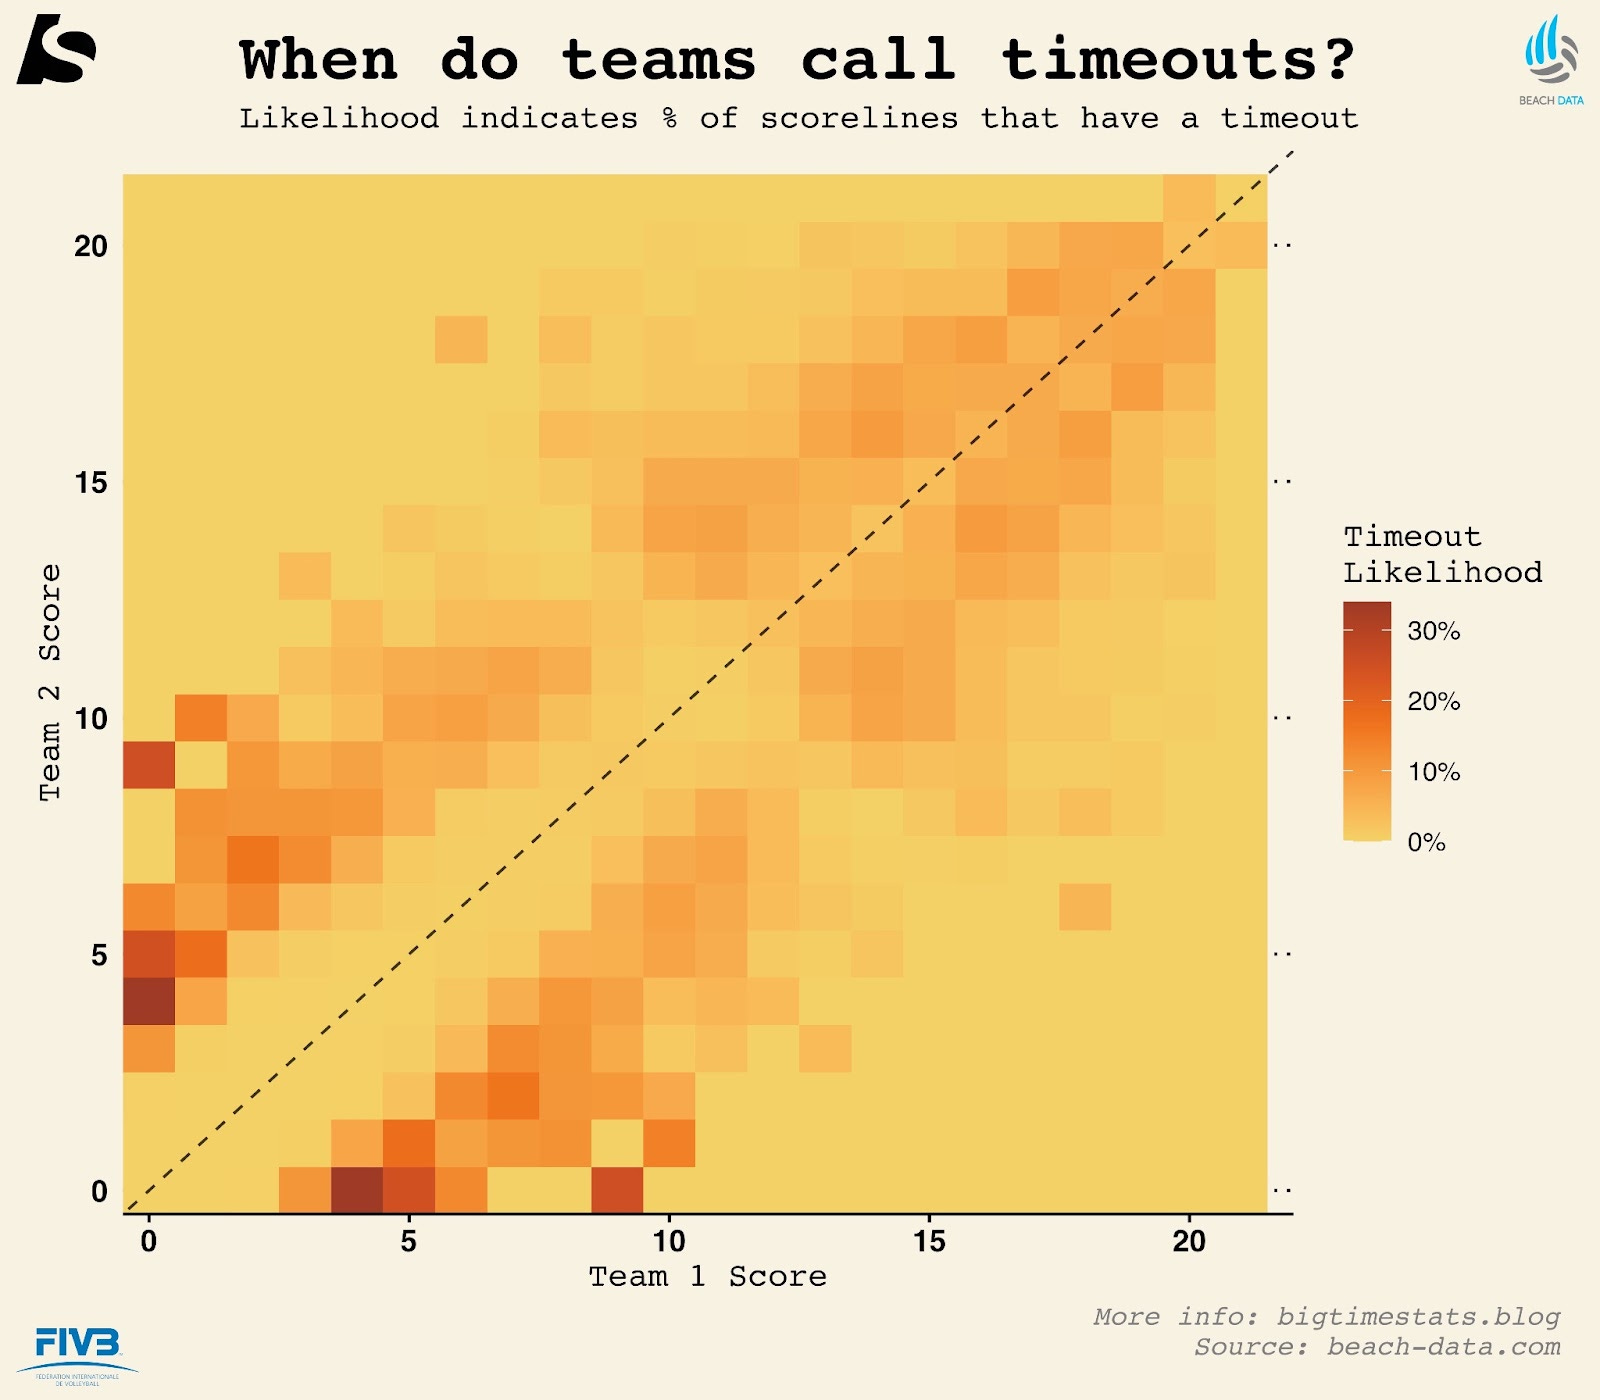
I also looked at the “likelihood” of timeouts called per scoreline. You can think of this as the # of timeouts called per scoreline / # of points played in that scoreline.
In this case, we see scorelines such as 4-0, 5-0, & 5-1 highlighted. When the score reaches 4-0, teams call a timeout in ~34% of points played. A 5-0 scoreline has timeouts in ~24% of points played.
In summary, it’s important to call a timeout in 2 key scenarios:
Early in the set before the team runs away with the lead
Later in the set in tighter scorelines (1-2 point differences) to prevent an insurmountable lead from taking hold to victory
In future posts, we’ll examine the most optimal time to call a timeout to maximize your chances of winning. Subscribe to not miss out!
Would also be interesting to look at sideout percentage... maybe the effect is not more serve-mistakes, but deliberately reduced risk at serve, that might lead to higher SO%.
I think the thing you want to look at is the results of the previous few points prior to the time out. You hinted at it, but teams call time outs to stop the momentum of their opponents. Of course later in the set, points have higher leverage. They also tend to avoid calling time outs near the technical time out and side changes. I’ll bet if you consider these factors you could create a model such that time outs are very predictable.